import numpy as np
import pandas as pd
import matplotlib.pyplot as plt
from scipy.interpolate import make_smoothing_spline
import statsmodels.formula.api as smf
import statsmodels.api as sm
from patsy import dmatrix 5 Régression polynomiale et régression spline
Régression polynomiale
ozone = pd.read_csv("../donnees/ozone_simple.txt", header=0, sep=";")fig = plt.figure()
plt.plot(ozone.T12, ozone.O3, '.k')
plt.ylabel('O3')
plt.xlabel('T12')
fig.tight_layout()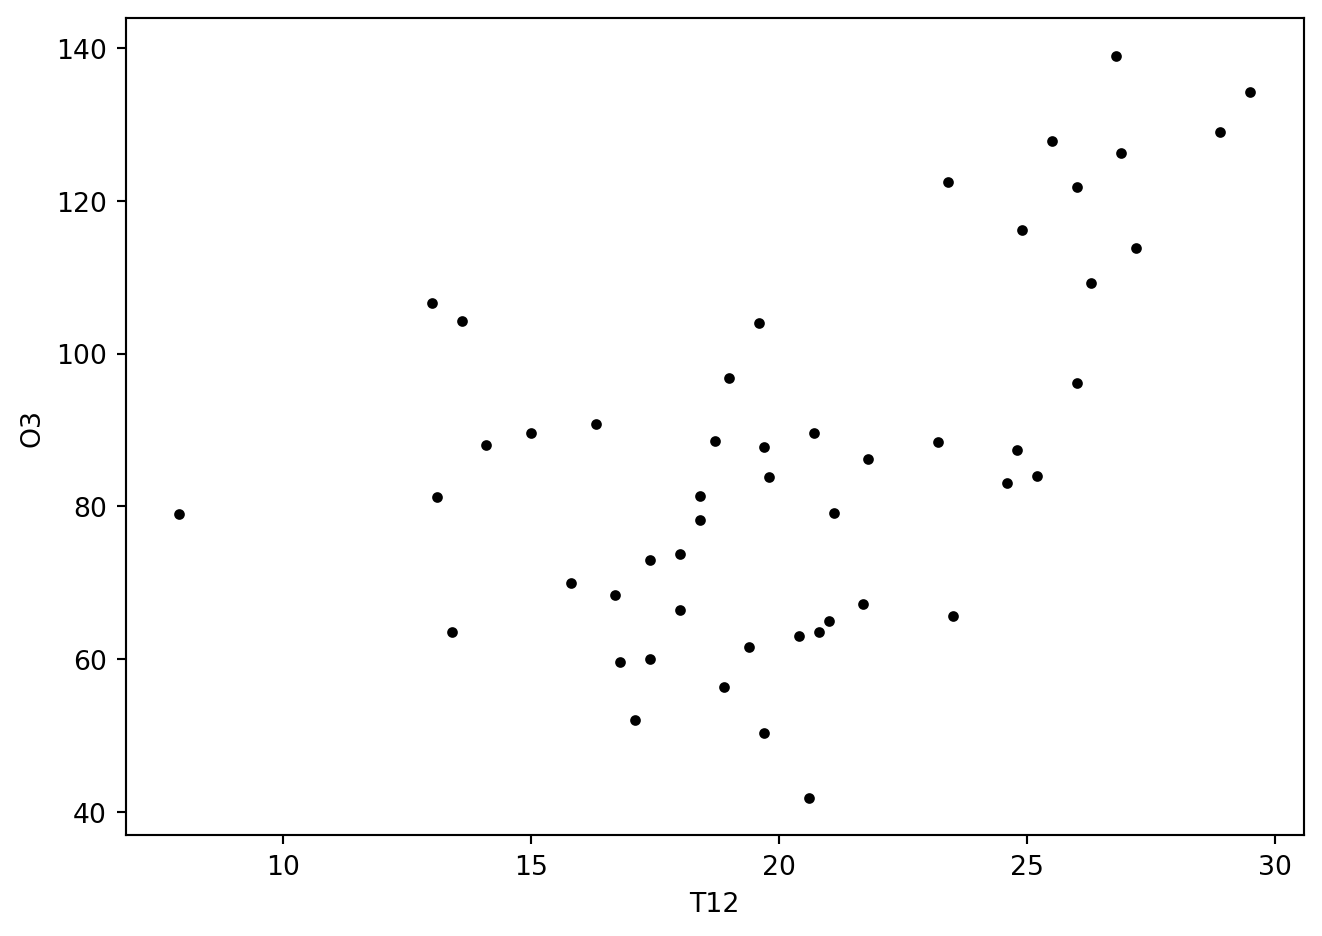
def polyreg(donnee, d=3):
    sigmax = donnee.T12.std()
    mini = donnee.T12.min() -sigmax
    maxi = donnee.T12.max()+sigmax
    grillex = np.linspace(mini, maxi, 100)
    aprevoir = pd.DataFrame({"T12": grillex})
    formula = "O3~1"
    for deg in range(d):
        if deg>0:
            formula = formula + "+ np.power(T12," + str(deg+1) + ")"
        else:
            formula = formula + "+ T12"
    repol = smf.ols(formula, donnee).fit()
    prev = repol.predict(aprevoir)
    return {"grillex": grillex, "grilley": prev}
ligne = ['-', '--', ':', '-.']
fig, ax = plt.subplots(1, 1)
for iter, ii in enumerate([1,2,3,9]):
tmp = polyreg(ozone, d=ii)
ax.plot(tmp["grillex"], tmp["grilley"], ls=ligne[iter])
ax.set_xlabel("T12")
ax.set_ylabel("O3")
ax.set_xlim(0, 45)
ax.set_ylim(0, 150)
ax.legend(['d=1', 'd=2', 'd=3', 'd=9'])
ax.plot(ozone.T12, ozone.O3, "k+")
fig.tight_layout()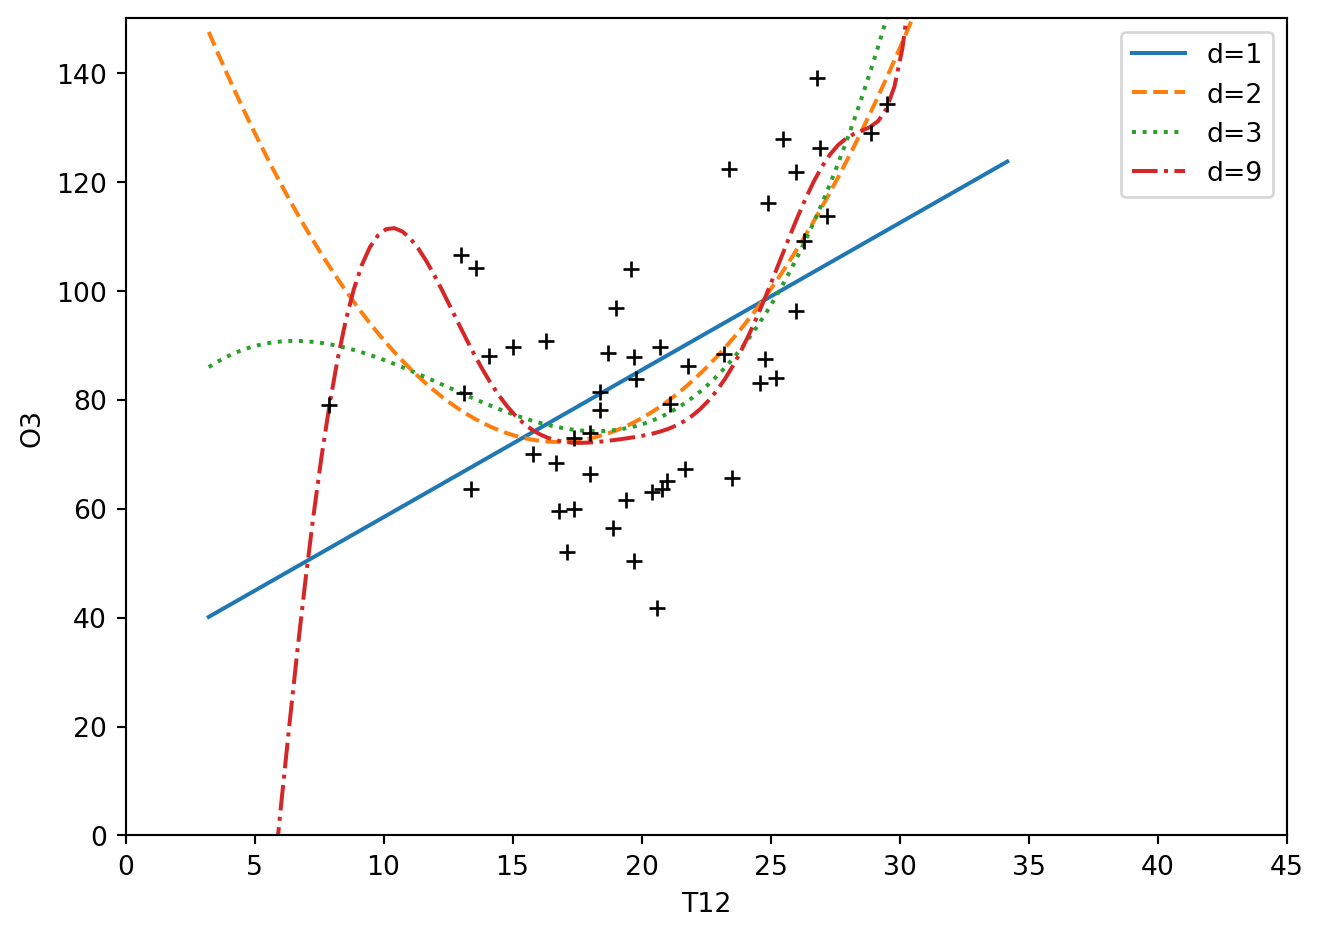
oz = ozone.copy()
oz.loc[oz.T12==7.9,"T12"] = 13
ligne = ['-', '--', ':', '-.']
fig, (ax1, ax2) = plt.subplots(2, 1)
for iter, ii in enumerate([1,2,3,9]):
    tmp = polyreg(ozone, d=ii)
    ax1.plot(tmp["grillex"], tmp["grilley"], ls=ligne[iter])

ax1.set_ylabel("O3")
ax1.set_xlim(5,35)
ax1.set_ylim(5, 150)
ax1.plot(ozone.T12, ozone.O3, "k+")
for iter, ii in enumerate([1,2,3,9]):
    tmp = polyreg(oz, d=ii)
    ax2.plot(tmp["grillex"], tmp["grilley"], ls=ligne[iter])

ax2.set_xlabel("T12")
ax2.set_ylabel("O3")
ax2.set_xlim(5,35)
ax2.set_ylim(5, 150)
ax2.plot(oz.T12, oz.O3, "k+")
fig.tight_layout()
oz = ozone.copy()
oz = oz.loc[oz.T12!=oz.T12.min(),:]
ligne = ['-', '--', ':', '-.']
fig, (ax1, ax2) = plt.subplots(2, 1)
for iter, ii in enumerate([1,2,3,9]):
    tmp = polyreg(ozone, d=ii)
    ax1.plot(tmp["grillex"], tmp["grilley"], ls=ligne[iter])

ax1.set_ylabel("O3")
ax1.set_xlim(5,35)
ax1.set_ylim(5, 150)
ax1.plot(ozone.T12, ozone.O3, "k+")
for iter, ii in enumerate([1,2,3,9]):
    tmp = polyreg(oz, d=ii)
    ax2.plot(tmp["grillex"], tmp["grilley"], ls=ligne[iter])

ax2.set_xlabel("T12")
ax2.set_ylabel("O3")
ax2.set_xlim(5,35)
ax2.set_ylim(5, 150)
ax2.plot(oz.T12, oz.O3, "k+")
fig.tight_layout()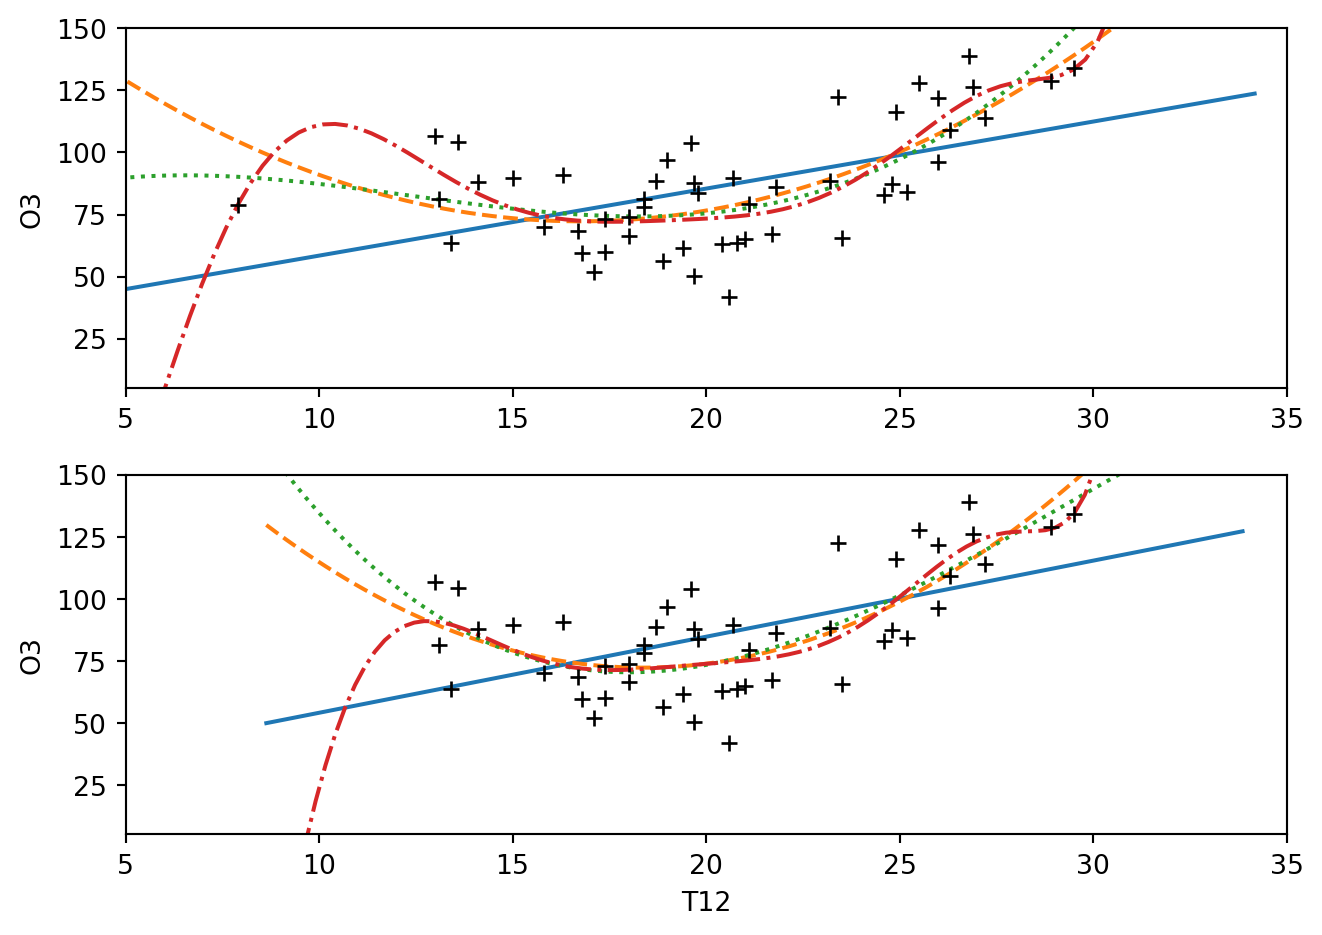
Régression spline
ind = ozone.T12 < 23
regd = smf.ols("O3~T12", data=ozone.loc[ind,:]).fit()
regf = smf.ols("O3~T12", data=ozone.loc[~ind,:]).fit()
gxd = np.linspace(3,23,21)
gxf = np.linspace(23,30,8)
prd = regd.params.iloc[0] +regd.params.iloc[1]*gxd
prf = regf.params.iloc[0] +regf.params.iloc[1]*gxf
fig, ax = plt.subplots(1, 1)
ax.plot(ozone.T12, ozone.O3, "k+", gxd, prd, "k-", gxf, prf, "k-")
ax.set_xlabel("T12")
ax.set_ylabel("O3")
ax.axvline(x=23, color="k")
fig.tight_layout()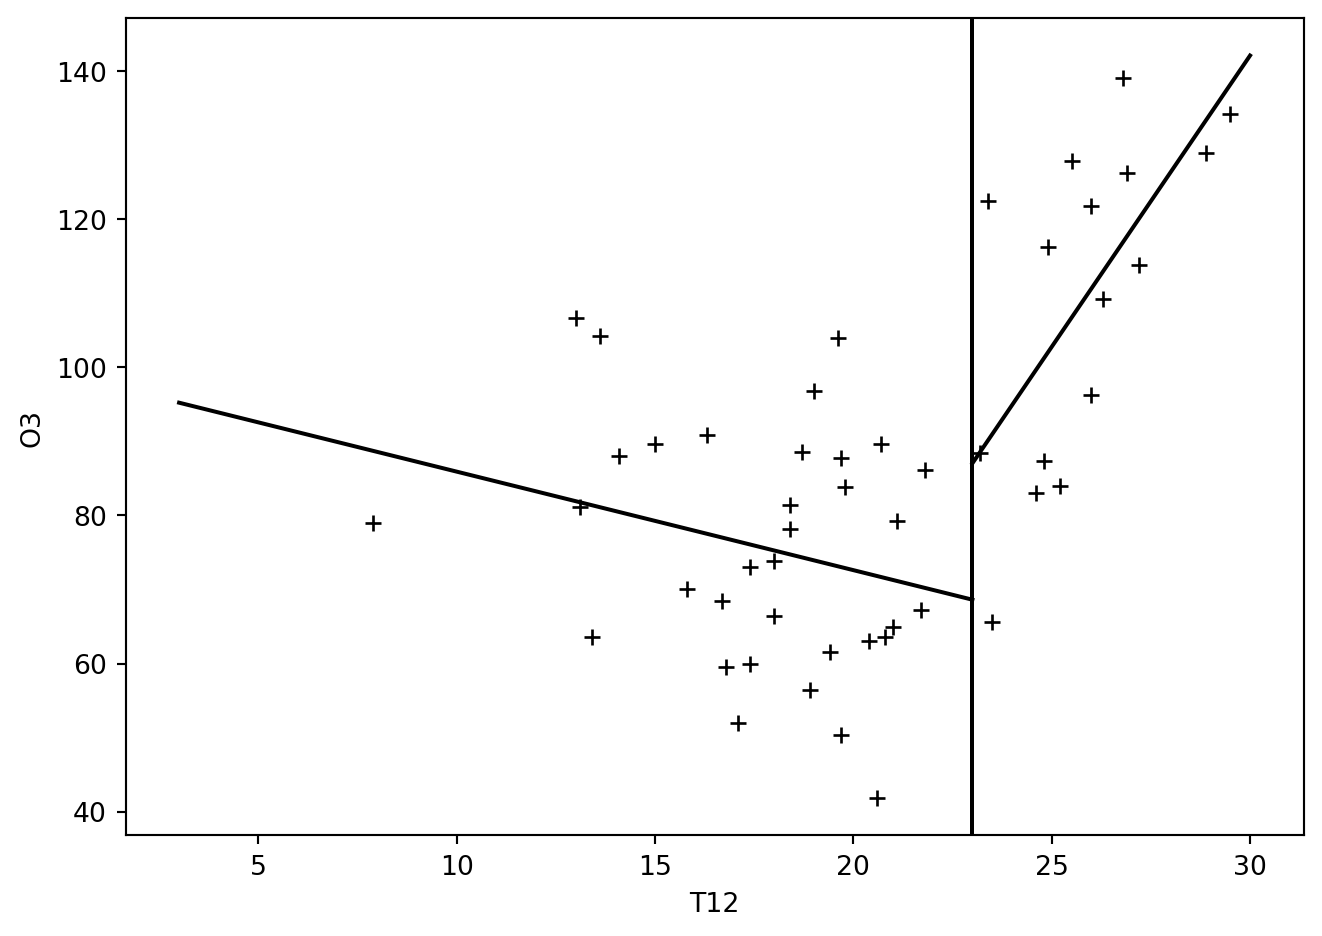
xi = [15, 23]
BS = dmatrix("~ 1 + bs(T12, degree=2, knots=xi, include_intercept=False, lower_bound=5, upper_bound=32)", ozone, return_type="dataframe")
BS.columns = ["bs" + str(i+1) for i in range(5)]
df = pd.concat([ozone.O3, BS.iloc[:,1:]], axis=1)

regs = smf.ols("O3~1+bs2+bs3+bs4+bs5 ", df).fit()
print(regs.params.round(3))
Intercept 51.102
bs2 61.544
bs3 5.562
bs4 70.459
bs5 106.712
dtype: float64regs = smf.ols("O3~ 1 + bs(T12, degree=2, knots=xi, include_intercept=False, lower_bound=5, upper_bound=32)", ozone).fit()
print(list(regs.params.round(3)))[51.102, 61.544, 5.562, 70.459, 106.712]df = pd.DataFrame({"T12": np.linspace(5,32,100)})
prev = regs.predict(df)
fig, ax = plt.subplots(1, 1)
ax.plot(ozone.T12, ozone.O3, "ko" , df.T12, prev, "-")
ax.set_xlabel("T12")
ax.set_ylabel("O3")
ax.axvline(x=15, color="k", ls="-")
ax.axvline(x=xi[1], color="k", ls="-")
fig.tight_layout()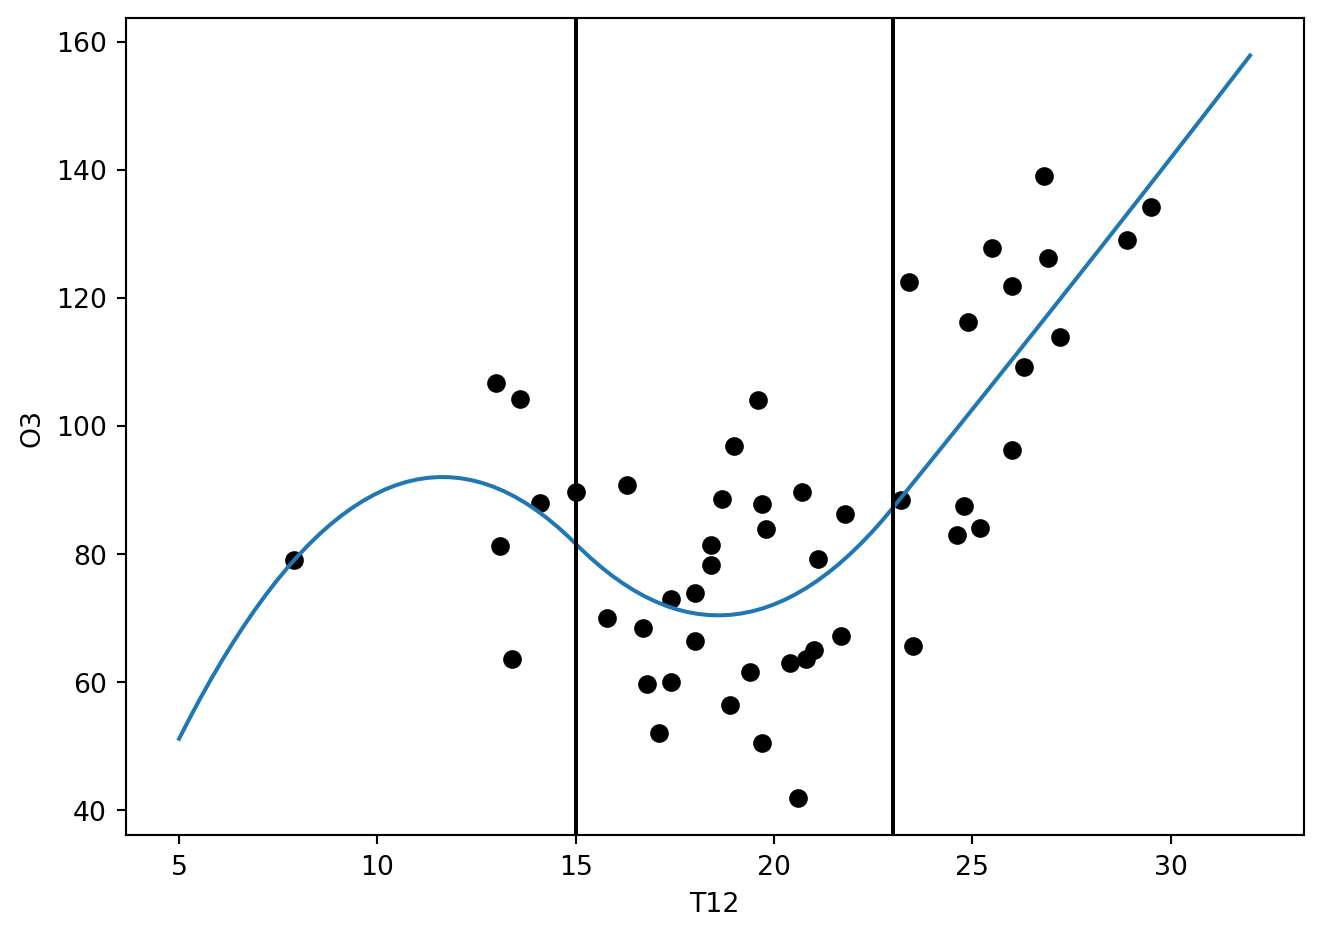
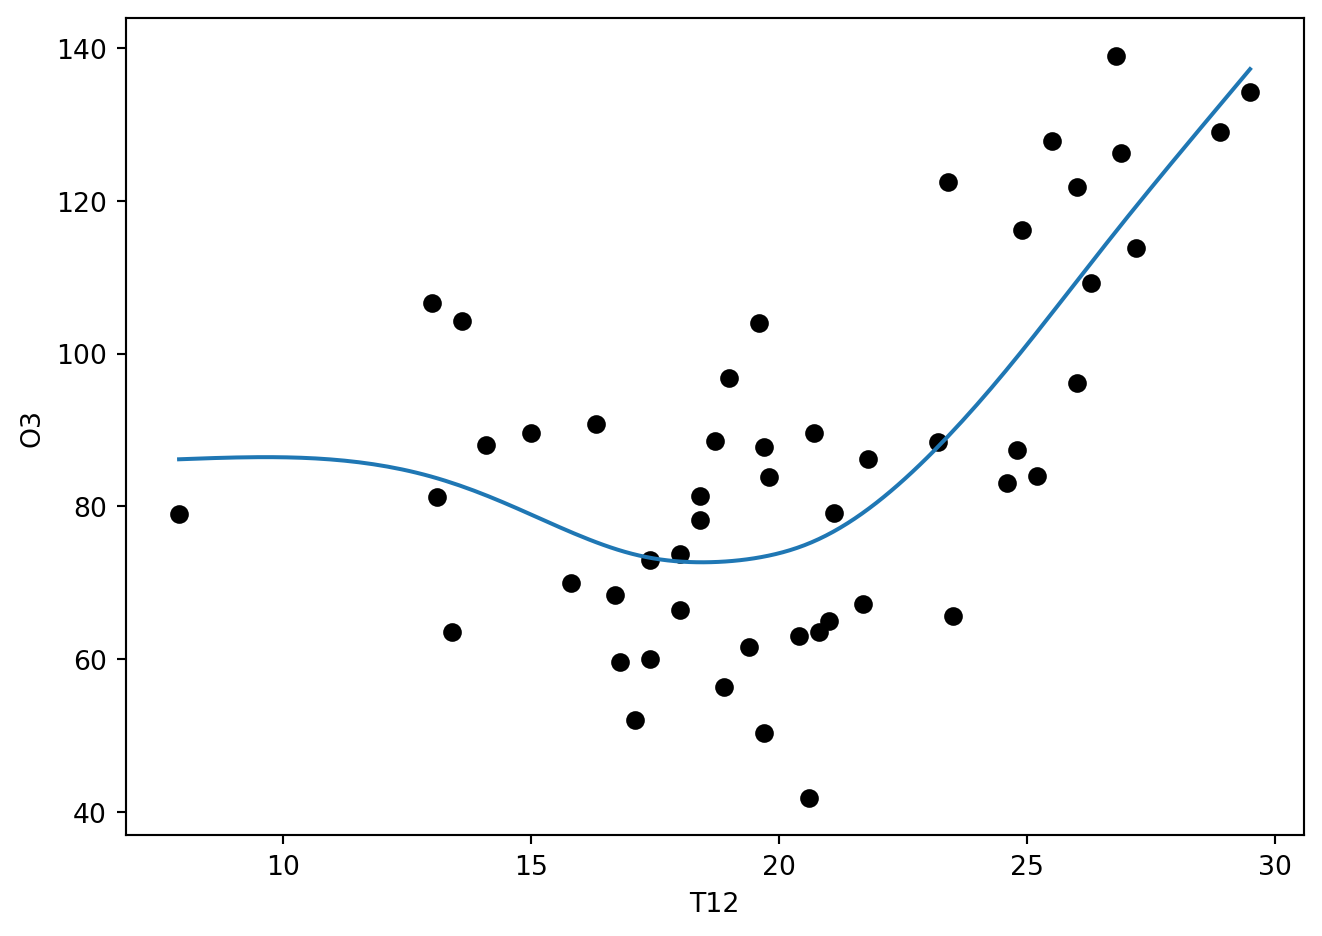
ozdedup = ozone.groupby("T12").mean()
ozdedup["w"] = ozone.groupby("T12").count()
spl = make_smoothing_spline(ozdedup.index, ozdedup.O3, ozdedup.w, lam=10000)
xi = np.linspace(ozdedup.index[0], ozdedup.index[-1], 150)
yi = spl(xi)
fig, ax = plt.subplots(1, 1)
ax.plot(ozone.T12, ozone.O3, "ko" , xi, yi, "-")
ax.set_xlabel("T12")
ax.set_ylabel("O3")
fig.tight_layout()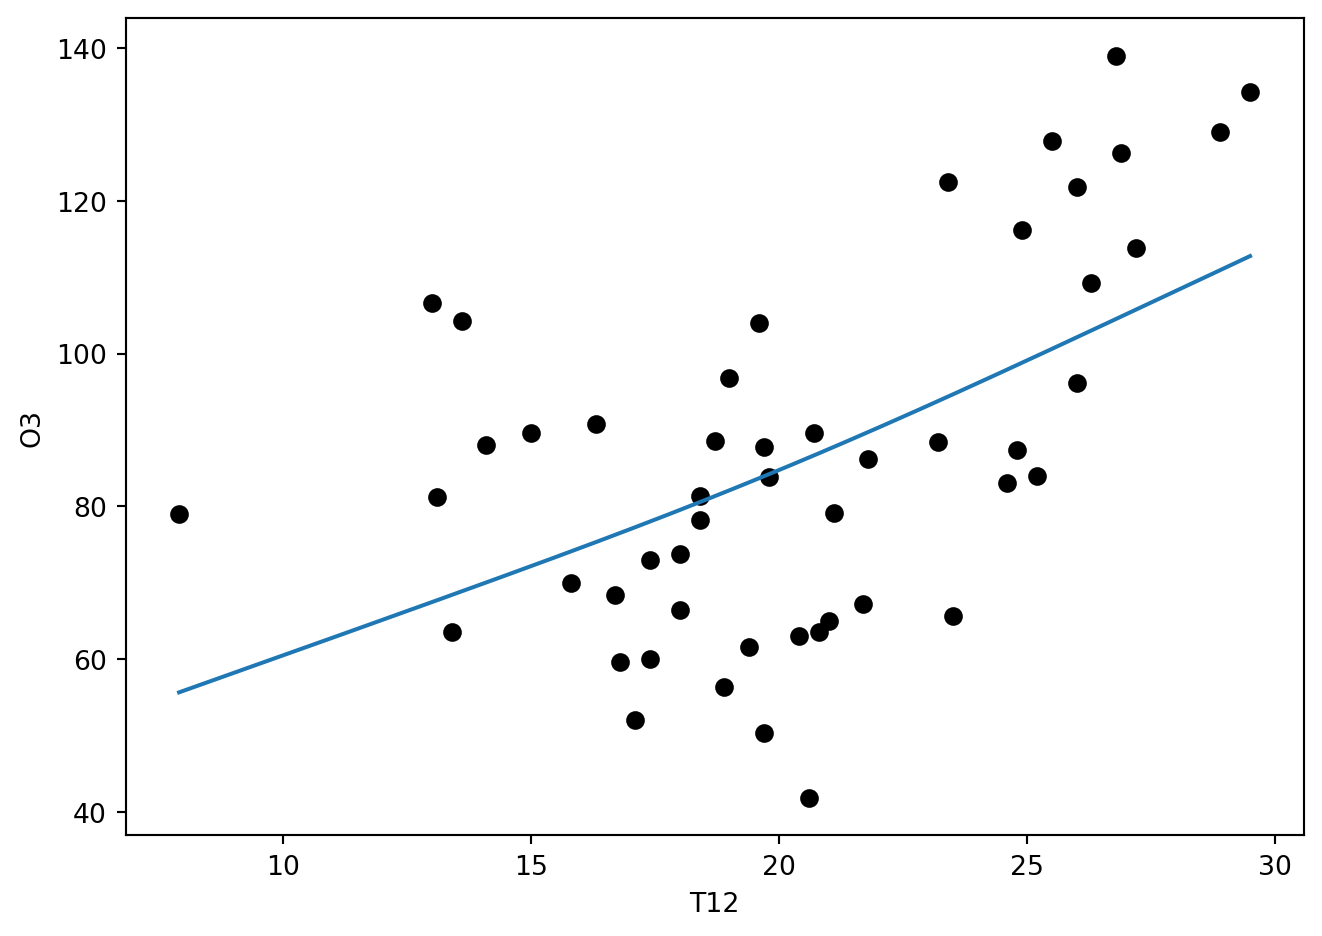
spl = make_smoothing_spline(ozdedup.index, ozdedup.O3, ozdedup.w, lam=1e-2)
xi = np.linspace(ozdedup.index[0], ozdedup.index[-1], 150)
yi = spl(xi)
fig, ax = plt.subplots(1, 1)
ax.plot(ozone.T12, ozone.O3, "ko" , xi, yi, "-")
ax.set_xlabel("T12")
ax.set_ylabel("O3")
fig.tight_layout()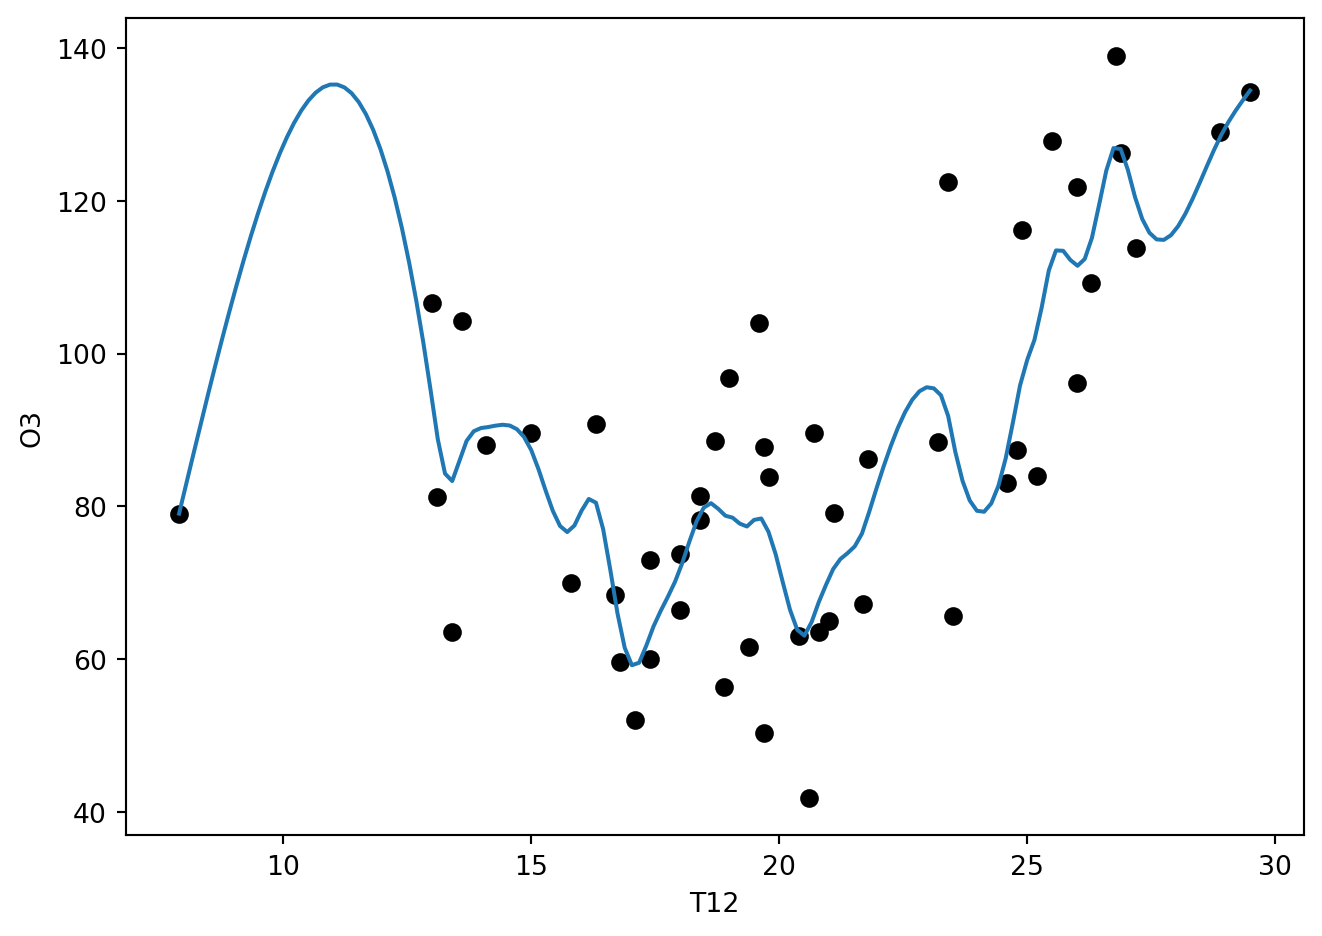
ozdedup = ozone.groupby("T12").mean()
ozdedup["w"] = ozone.groupby("T12").count()
spl = make_smoothing_spline(ozdedup.index, ozdedup.O3, ozdedup.w)
xi = np.linspace(ozdedup.index[0], ozdedup.index[-1], 150)
yi = spl(xi)
fig, ax = plt.subplots(1, 1)
ax.plot(ozone.T12, ozone.O3, "ko" , xi, yi, "-")
ax.set_xlabel("T12")
ax.set_ylabel("O3")
fig.tight_layout()