import pandas as pd
import statsmodels.formula.api as smf
import statsmodels.api as sm
import matplotlib.pyplot as plt
import scipy.stats as stats
from statsmodels.nonparametric.smoothers_lowess import lowess3 Validation du modèle
ozone = pd.read_csv("../donnees/ozone_long.txt", header = 0, sep = ";")
mod_lin6v = smf.ols("O3 ~ T6+T12+Ne12+Ne15+Vx+O3v", data=ozone).fit()
infl = mod_lin6v.get_influence()
index = pd.Series(range(1, ozone.shape[0]+1))
resloess = sm.nonparametric.lowess(infl.resid_studentized_external,index)plt.plot(index, infl.resid_studentized_external,"+k")
plt.plot(resloess[:,0], resloess[:,1],"r")
ax = plt.gca()
ax.axhline(y=-2)
ax.axhline(y=2)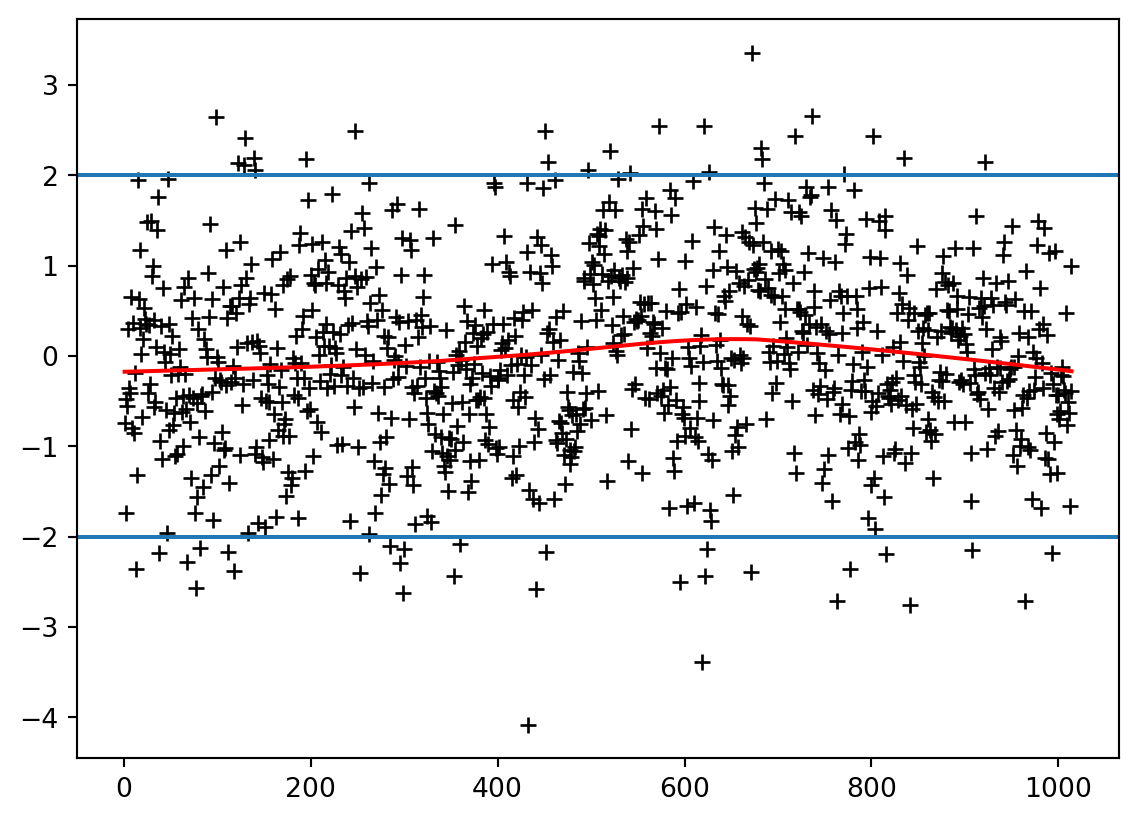
#df = ozone.shape[0] - 3
sm.qqplot(infl.resid_studentized_external, \
    stats.t,distargs=(ozone.shape[0]-infl.k_vars-1,), line='s')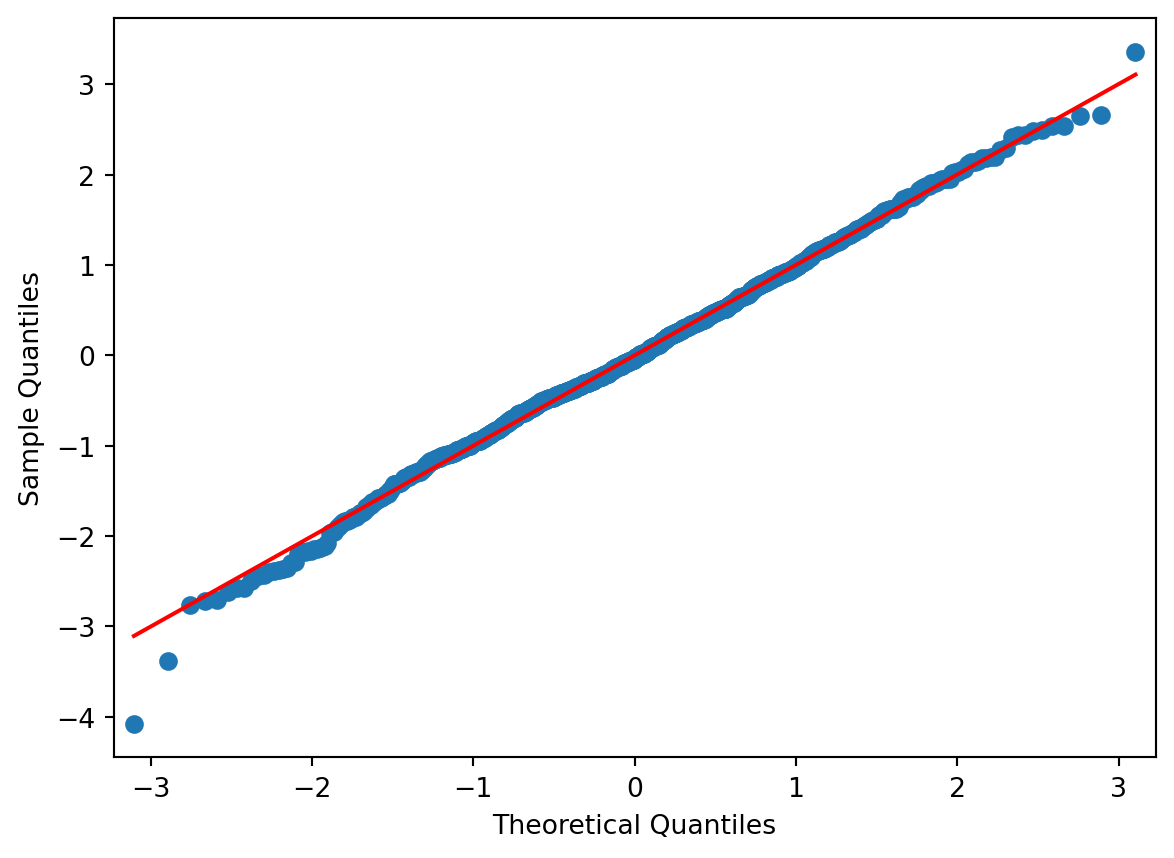

cook, pval =infl.cooks_distance
n, p =ozone.shape
fig = plt.figure()
plt.bar(index, cook, lw=2, color='k')
fig.tight_layout()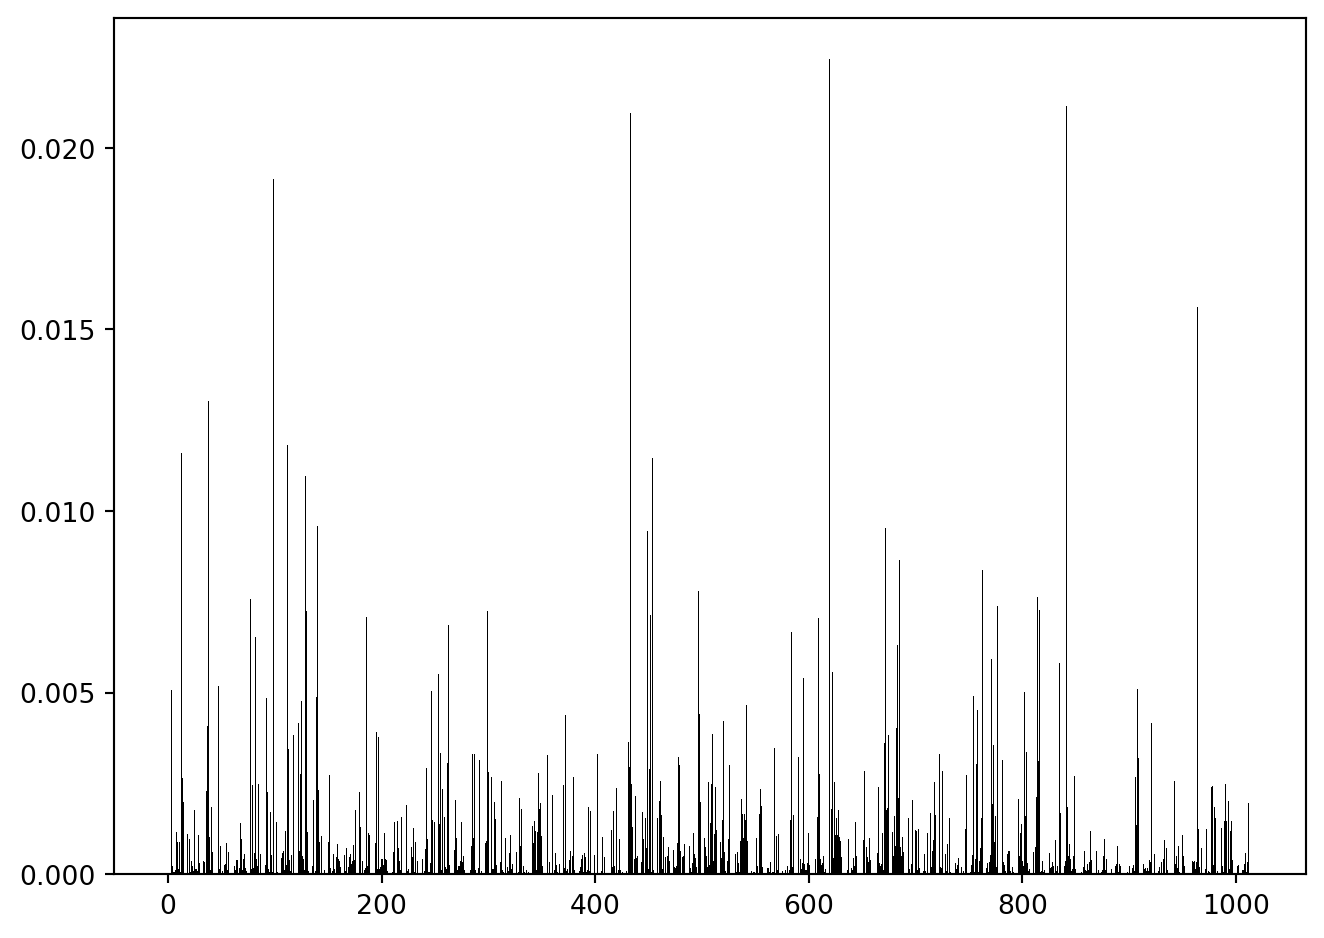
hii = infl.hat_matrix_diag
seuil1 = 3*p/n
seuil2 = 2*p/n
plt.bar(index, hii, lw=2, color='k')
ax = plt.gca()
ax.axhline(y=seuil1, color='r', ls=':')
ax.axhline(y=seuil2, color='r', ls='--')
fig.tight_layout()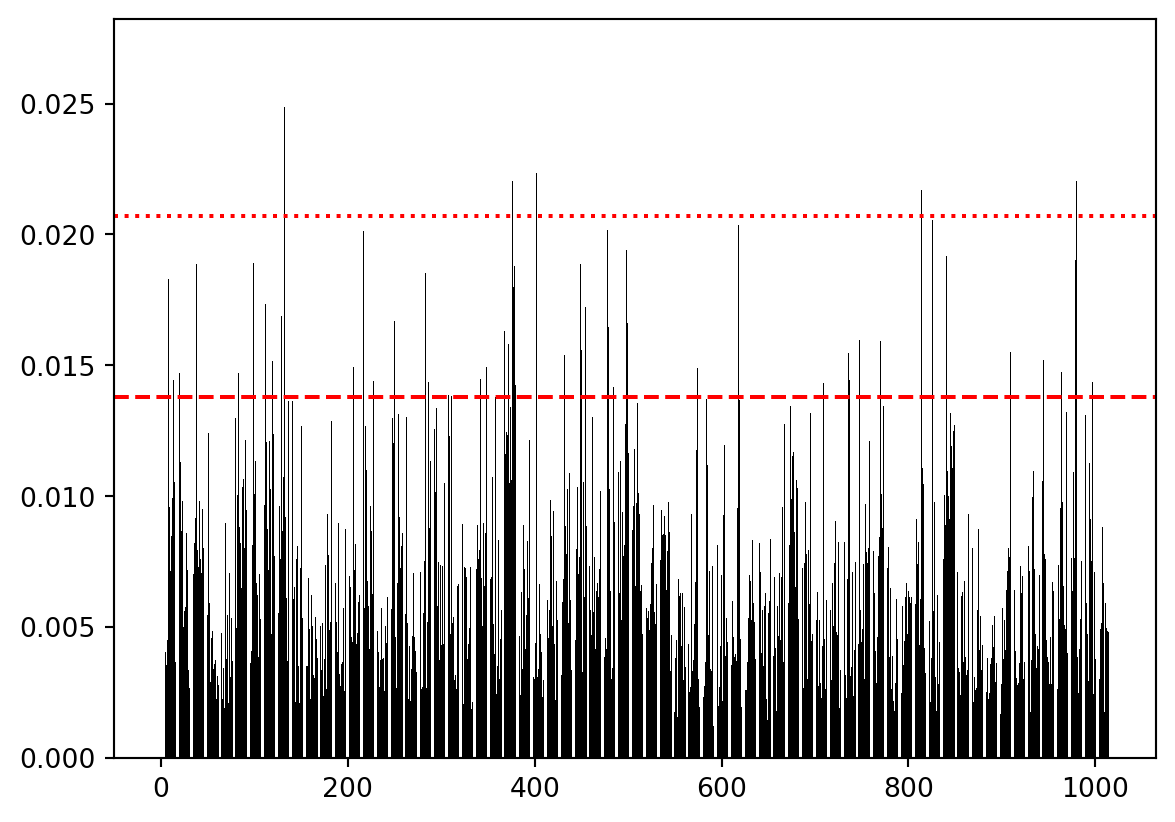
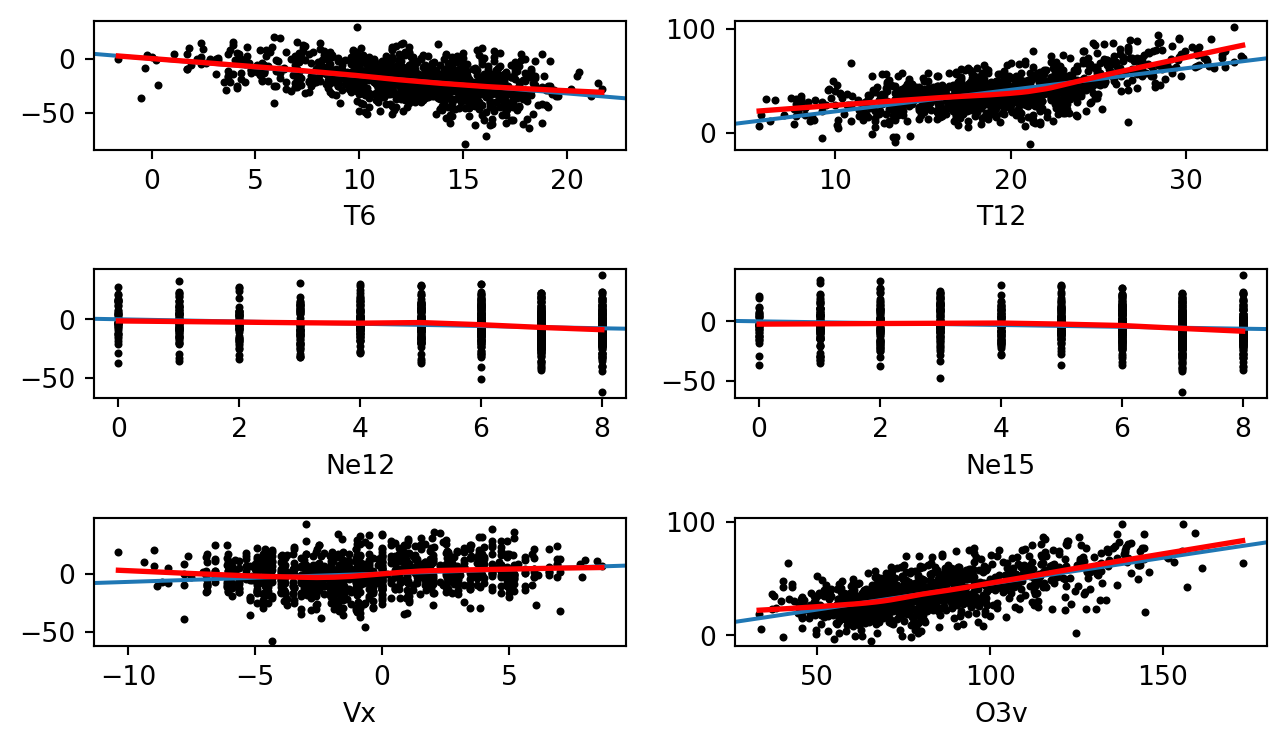
fig = sm.graphics.plot_ccpr_grid(mod_lin6v)
fig.suptitle("", fontsize=16)
marker_size = 2
for ax in fig.axes:
    ax.set_ylabel('')
    ax.lines[0].set_color('black')
    for line in ax.get_lines():
        line.set_markersize(marker_size)

plt.subplots_adjust(top=0.99, bottom=-0.5, left=0.01, right=0.99, hspace=0.1, wspace=0.4)
fig.tight_layout()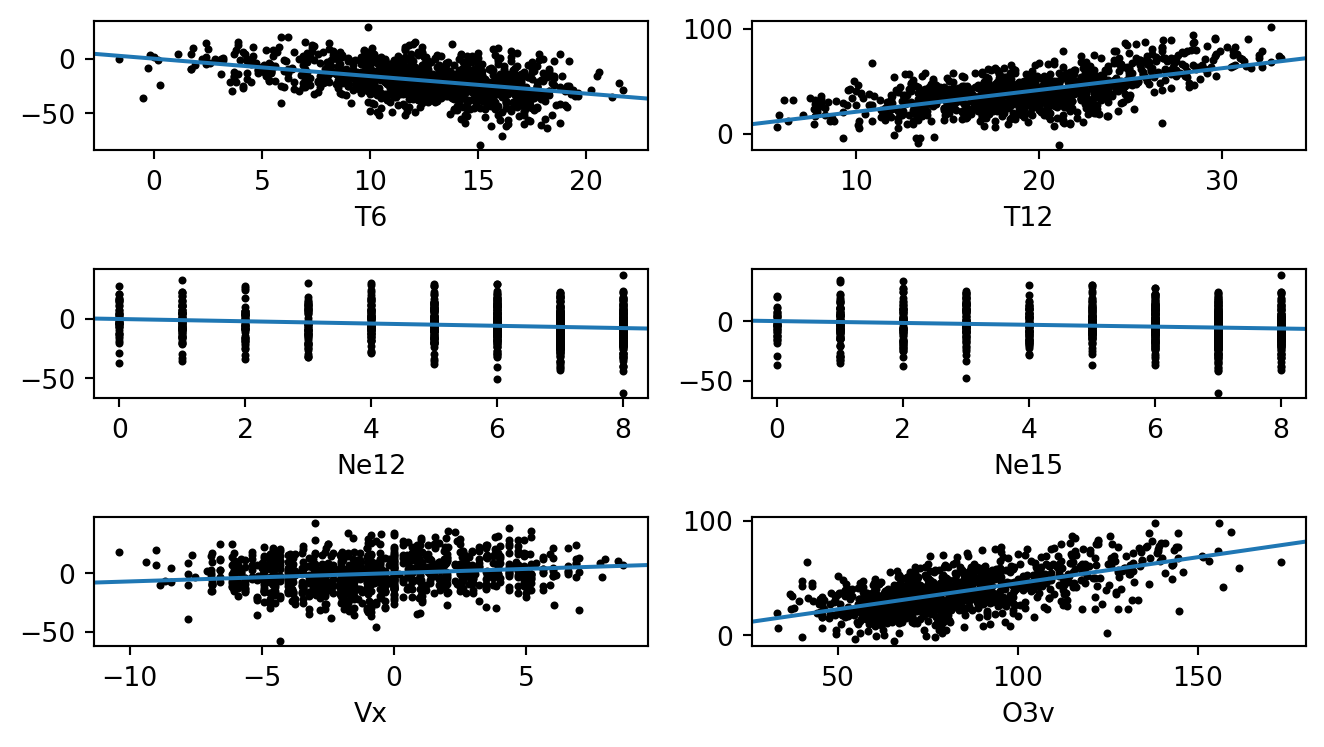
def plot_ccpr_grid_with_loess(mod, exog_idx=None, grid=None, fig=None):
    fig = sm.graphics.plot_ccpr_grid(mod, exog_idx, grid, fig)
    fig.suptitle("", fontsize=16)
    marker_size = 2
    for ax in fig.axes:
        x = ax.lines[0].get_xdata()
        y = ax.lines[0].get_ydata()
        ax.set_ylabel('')
        ax.lines[0].set_color('black')
        for line in ax.get_lines():
            line.set_markersize(marker_size)
        # Rajout de loess en rouge
        smooth = lowess(y, x, frac=2/3)
        ax.plot(smooth[:, 0], smooth[:, 1], color='red', lw=2)
    return fig

fig = plot_ccpr_grid_with_loess(mod_lin6v)
fig.tight_layout()